

A strong site selection and business expansion strategy can be the difference between a location that thrives and one that drains your budget inside 18 months. Consider this, teams using foot traffic analytics are opening 3x more stores with higher success rates, according to GrowthFactor. That gap exists because most business owners make expansion decisions on instinct and cursory drive-bys, not on live market data.
Site selection and business expansion strategy requires live competitor data, customer sentiment analysis, and neighborhood demand signals, not static reports or gut feel. This guide is for business owners, franchisees, and commercial real estate professionals who want a repeatable research workflow.
Why Most Site Selection Decisions Fail
The problem is not carelessness, it is that the data most owners rely on is already outdated by the time it reaches them. Traditional site selection research leans on static demographic reports, broker-supplied traffic counts, and anecdotal knowledge from the neighborhood. None of that tells you what customers are saying about the coffee shop two doors down, or whether a competing concept just opened on the same block last month. By the time a market report reaches your desk, the conditions it describes have already shifted.
Live location intelligence changes the equation. When you can pull customer review data from Yelp, Google Maps, and TripAdvisor in real time, map every direct competitor in a target trade area in seconds, and ask plain-language questions like “What do customers complain about at the top burger spots in this zip code?” Your expansion decisions become grounded in current reality.

Foot traffic patterns are one of the four core signals in any strong site selection and business expansion strategy.
Did You Know?
58% of retail professionals say that using customer location data directly boosts revenue.
Source:
Fortune Business Insights (2025)
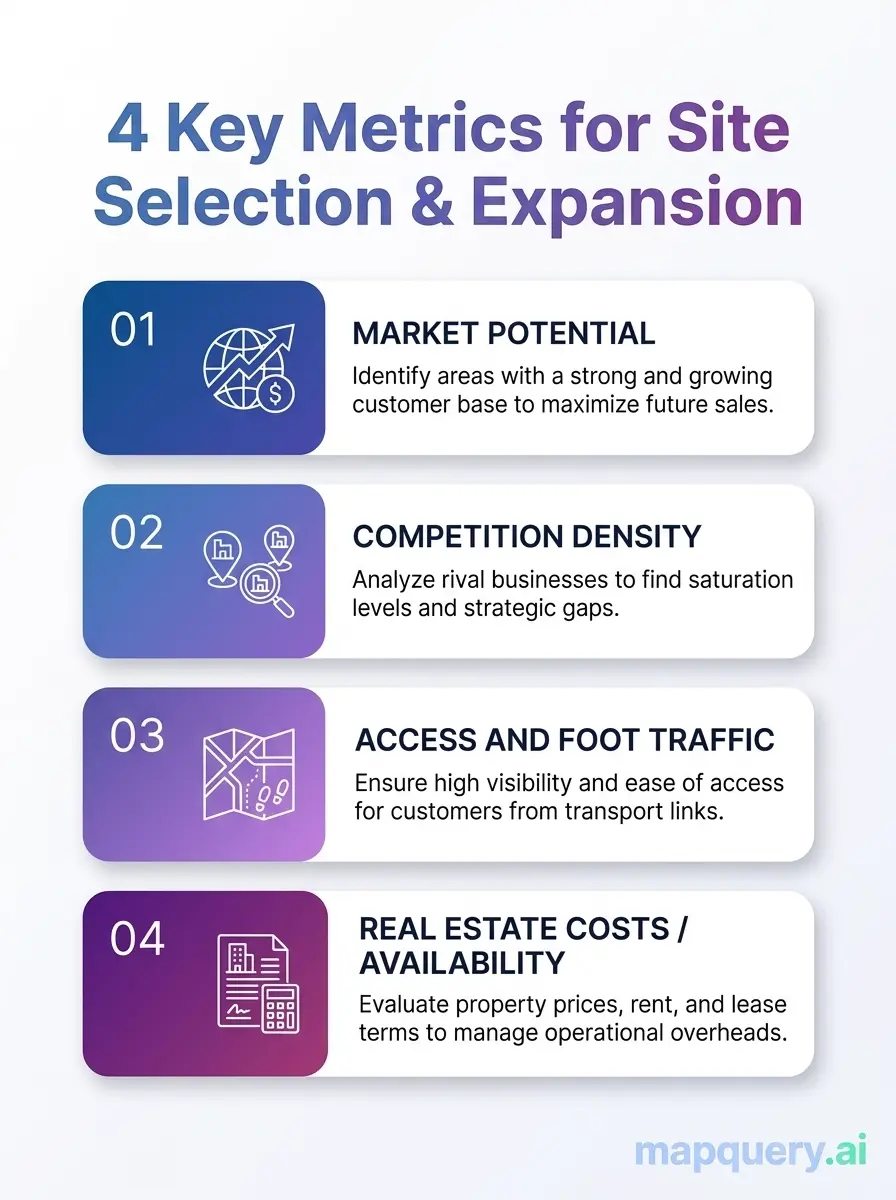
The 4 Signals That Actually Drive Site Selection and Business Expansion Strategy
The question is not just whether your data is live, it is whether you are looking at the right signals. These four are what separate confident expansion decisions from expensive guesses.
Competitor Density
How many direct competitors operate in the target trade area, and how are they performing? A crowded market is not automatically bad, a cluster of similar businesses can signal strong demand. But mapping the competitive landscape tells you whether there is room for another entrant, where the gaps are, and which operators are struggling enough that their customers are available to win.
Customer Sentiment
Star ratings are a proxy. What customers actually say in reviews, the specific complaints and the consistent praise, tells you what unmet needs exist in a market. That is where your differentiation opportunity lives. A neighborhood full of competitors with recurring complaints about slow service or limited options is a neighborhood with an opening, not a saturated one.
Demand Signals
Are there businesses adjacent to your category that suggest strong foot traffic and aligned buyer profiles? A thriving gym next to a potential smoothie bar location is a demand signal worth noting. So is a dense cluster of office buildings near a lunch-focused concept, or a high-volume nail salon near a waxing studio. These co-tenancy patterns tell you whether the customer you need is already in the area.
Neighborhood Stability
Are businesses in the area opening or closing? What is the tenure of existing operators? A block where businesses turn over every 18 months is a different bet than one where operators have been running for five or more years. This context helps you assess whether a location is a rising market, a stable one, or one quietly losing momentum.
MapQuery.ai’s core feature set is built around surfacing exactly these four signals in real time, without requiring you to manage multiple data subscriptions or learn GIS software. The platform is designed for operators who need answers, not analysts who need tools.
The four metrics that separate strong expansion decisions from expensive guesses. Use these signals to evaluate any candidate location before committing to a lease.
Who This Research Workflow Is For
The use case shapes how you run the research. Find your situation below, then use the workflow that follows to build your process.
Franchise Expansion
Evaluating franchise territories is not a data problem. It is an organization problem. Most development managers can find competitor information, the challenge is keeping it sorted by territory so the final comparison is actually useful.
MapQuery.ai’s franchise site selection workflow handles this through a project-per-territory structure. Open one project for each market you are evaluating, map competitor density within it, and pull AI-generated sentiment summaries for the locations you are tracking. When you are ready to compare territories, your research is already organized by market rather than scattered across browser tabs and notes.

Competitor mapping reveals which blocks are saturated and which have room for a new entrant, before you tour a single space.
Retail Site Selection
When you are down to two or three shortlisted locations, the decision usually comes down to the neighborhood, not the floor plan. Which block has the competitive dynamic that favors your concept? Which area has competitors with recurring complaints your offer can address?
MapQuery surfaces that picture fast. Navigate to any candidate location, search for your category, and every competitor in the viewport appears as a pin. Click one to read an AI-generated summary of what customers say, what is working, and what is not. What used to take an afternoon of cross-referencing review platforms takes a few minutes per location.\
Commercial Real Estate
Broker packages tell you square footage, rent, and traffic counts. They do not tell you what kind of customers actually visit the area, how existing tenants are performing, or whether the neighborhood is gaining momentum or losing it. That gap is where bad location decisions get made.
MapQuery.ai’s commercial real estate research workflow fills it. Map every business within a defined radius, query the customer profile of the area in plain English, and read sentiment data on existing tenants before you schedule a site tour. It is the ground-level intelligence that broker materials consistently leave out.
How to Build a Site Selection Workflow with Live Location Data
The sequence below works for any of the use cases above. Run it once to learn the tool; run it on every new territory to build a consistent research basis.
Step 1: Define your target trade area
Navigate to the city, neighborhood, or specific block you are evaluating. Research is scoped to what is visible in the map view, so set your viewport before you start.
Step 2: Run your competitor search
Use See What’s Around You to surface all relevant businesses in the viewport. This gives you an immediate density read before you spend a single research credit.
Step 3: Query the market in plain English
Use Just Ask a Question to ask things like “What do customers in this area complain about most?” or “What types of demographics visit the restaurants on this block?” The AI synthesizes live review data from multiple sources and returns a cited answer you can save.
Step 4: Read customer sentiment
Use Customer Pulse to understand what customers say about your direct competitors. Differentiation opportunities live in the specifics, not the star ratings, but the recurring complaints and the consistent praise.
Step 5: Save your work by territory
Use Saved Map Markers and Save Your Research to keep candidate sites organized by project. Each territory stays separate so comparisons stay clean.
Step 6: Review and decide
Pull up your Saved AI Results across candidates. With everything in one place, the final decision is a structured comparison rather than a memory exercise.
You can walk through a live version of this workflow using the MapQuery map preview before creating an account. The default demo loads coffee shops around South Congress in Austin, TX, which gives you a realistic feel for how the research interface works in a real commercial corridor.
Built by GeoAsset LLC | mapquery.ai | See current pricing at mapquery.ai/pricing
Real-World Use Cases for Site Selection and Business Expansion Strategy
Three examples of how operators use this research workflow in practice.
The Multi-Unit Restaurant Operator
A regional fast-casual operator is evaluating three neighborhoods in a new metro for their next two locations. They open one MapQuery project per neighborhood, map every competing concept within a half-mile radius, and use Customer Pulse to identify recurring complaints across competitor reviews. They find that two neighborhoods have saturated their category, but the third shows strong foot traffic with competitors receiving consistent negative feedback about wait times and limited menu variety. That is where they focus their lease negotiations.
The Franchise Development Manager
A franchise development manager is evaluating 12 candidate territories for a home services franchise. Using the
franchise site selection workflow
, they create one project per territory and use Just Ask a Question to query what types of home service businesses already operate in each area and how customers rate them. By the end of the research phase, they have eliminated six territories based on competitor saturation and concentrated their outreach on the six with the strongest unmet demand signals.
The Commercial Real Estate Broker
A CRE broker is advising a retail client on three shortlisted spaces. Before the site tours, they use MapQuery to walk the client through the neighborhood mix, customer sentiment data, and competitor density around each property. The live data gives the client a ground-level picture that broker materials alone cannot provide.
Opening a new location is the beginning, not the end. The same platforms MapQuery queries during research (Yelp, Instagram, TripAdvisor) are the ones customers use to find and evaluate you after you open. Your digital listing for that address needs to be accurate from day one.
Did You Know?
53% of consumers say inaccurate business listings will drive them away.
Source:
Rio SEO (2025)
Final Thoughts
Site selection and business expansion strategy has never been easier to research, but only if you are using live data. The tools that existed five years ago required either enterprise budgets or a data specialist on staff, and that is no longer the case.
MapQuery.ai gives any business owner, franchisee, or CRE professional the ability to query any location in plain English, surface competitive context in seconds, and save that research in an organized project structure built for multi-market comparison. The free tier is genuinely usable for single-location evaluation, while the Pro tier supports the depth that serious expansion planning demands.
Ready to research your next location?
Start with 10 free daily credits. No credit card required. See what the data says about your next market before you commit to it.
Frequently Asked Questions
What is site selection in business expansion strategy?
Site selection in business expansion strategy is the process of evaluating geographic locations to determine which physical or trade areas offer the best conditions for a new business location. It involves analyzing competitor density, foot traffic patterns, customer sentiment, and neighborhood demand signals to reduce the risk of a poor location decision.
What data should I look at before choosing a new business location?
Before choosing a new business location, you should look at nearby competitor density, customer review sentiment from platforms like Yelp and Google Maps, foot traffic demand signals, and the types of businesses that are already thriving in the area. Live location intelligence tools like MapQuery.ai pull this data in real time so your decision is based on current market conditions, not stale reports.
How do I evaluate a trade area for franchise site selection?
To evaluate a trade area for franchise site selection, map your direct competitors within the target radius, read AI-generated summaries of how those businesses are performing, and assess whether the customer base in that area matches your target buyer profile. MapQuery.ai’s
franchise site selection workflow
lets you run this research one territory at a time and save results by project for clean comparison.
Is MapQuery.ai worth using for business expansion research in 2026?
Yes, MapQuery.ai is a practical tool for business expansion research in 2026, especially for owners who need live location data without paying for enterprise GIS software. The free tier gives you 10 daily research credits and up to 3 saved projects with no credit card required, making it accessible for early-stage expansion planning.
What is the difference between a free and Pro account for site selection
research?
The free tier at MapQuery.ai provides 10 daily research credits, up to 3 saved projects, and up to 50 locations per project. The Pro tier expands this to 1,000 monthly credits, 10x deeper research from more sources, unlimited projects, and up to 500 locations per project, which is better suited to multi-market expansion or franchise territory evaluation. See the full comparison at
mapquery.ai/pricing
.
Can I use location intelligence tools to research commercial real estate
before signing a lease?
Yes. Location intelligence tools are specifically useful before signing a commercial real estate lease because they let you understand neighborhood dynamics, nearby business mix, and customer sentiment before you commit to a space. MapQuery.ai’s
commercial real estate research workflow
is built for exactly this use case and surfaces live data from the review platforms customers actually use.
How accurate is AI-generated location data for site selection decisions?
AI-generated location data is only as accurate as its underlying sources, which is why MapQuery.ai pulls live data from Yelp, Google Maps, TripAdvisor, and Instagram rather than relying on a static database. Every AI answer is sourced and cited so you can verify the origin of any specific data point, which makes the output useful for real business decisions rather than just directional guidance.